介绍了两种使用matplotlib库绘制动态图像的两种方法,一是在循环中不断更新图像以及加短暂暂停实现动态效果,但是不能直接保存为动态图像;二是使用animation模块来制作动画,不但可以直接显示动态图像,还可以导出多种格式的动态图像。
matplotlib是python的一个绘图库,可以用于绘制种类丰富图表,也可以实现动态图绘制。绘制动态图有两种可行的方法:1、循环更新图像;2、使用matplotlib.animation。第一种方法实现较为简单,但是不能保存图像,第二种实现方法稍复杂一些不过可以保存图像为gif、MP4等类型,也可以保存为HTML5视频。这里重点介绍第二种方式。
使用循环更新图像
这种方法比较简单,可以实现动态图像的预览。循环中的pause()是十分必要的,cla()用于坐标区域内前一时刻而图像。
import numpy as np
import matplotlib.pyplot as plt
fun = lambda x,t:np.sin(2*x+t)
x=np.arange(0,2*np.pi,np.pi/100)
t=range(0,100)
fig,ax=plt.subplots()
for i in t:
    y=fun(x,i/100)
    ax.plot(x,y)
    ax.text(1,1,'Time={}s'.format(i/100))
    plt.pause(1e-2)
    ax.cla()
plt.show()
animation
animation是matplotlib中的动画模块,可以用于绘制实时动画。通常有FuncAnimation与FuncAnimation()类用于创建动画,而保存动画直接使用动画类的save()。
FuncAnimation
FuncAnimation(fig, func, frames=None, init_func=None, fargs=None, save_count=None, *, cache_frame_data=True, **kwargs)
其中有几个常用的参数:
fig - 指定用于绘图的figure对象;
func - 用于更新动画的每一帧的函数;
frames - 动画指定帧数,可以是terable, int, generator function, or None。如果参数是generator且帧数大于100时需要save_count参数指定要保存的参数,否在存储动画时最多只保存100帧;
init-func - 用于初始化的函数,相当于动画第0帧,如果没有则使用func的第一帧。
更多更详细的说明参见说明文档
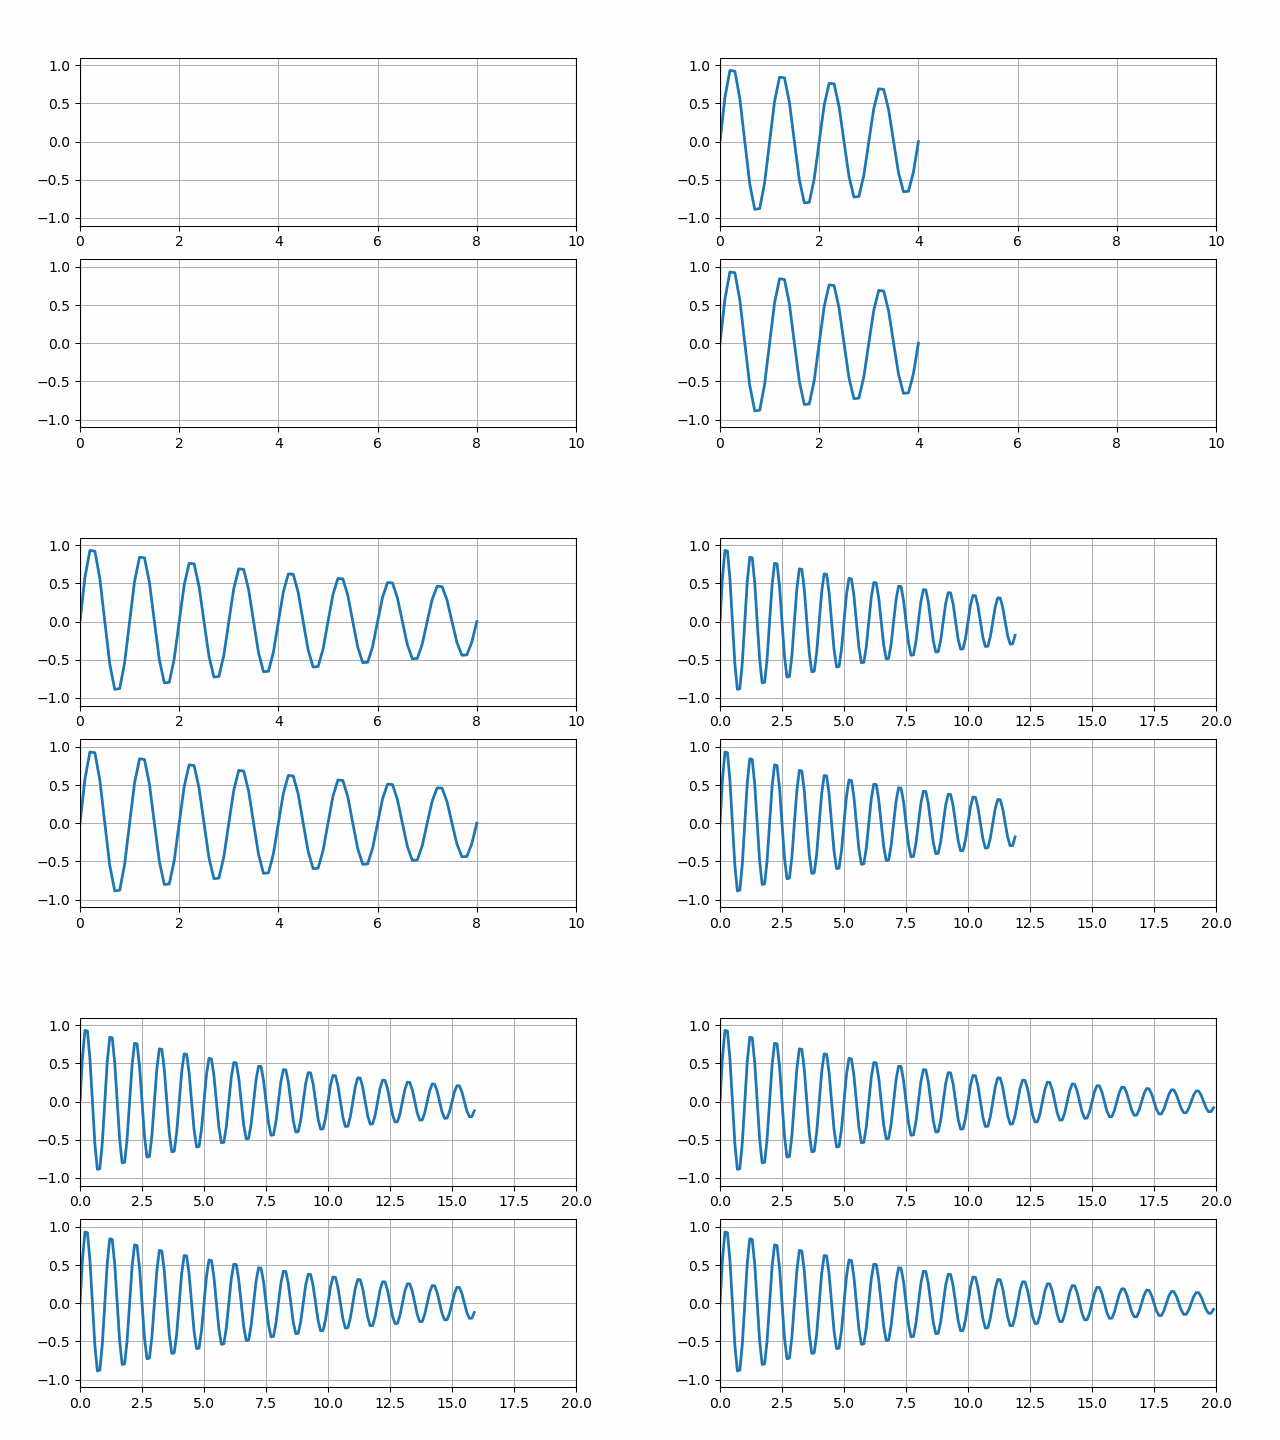
下面这段代码是根据官方文档中的示例代码改写的,注意其中注释掉了init()中对line的初始化,因为在init()中初始化lines对象列表,且后面先后使用plt.show()显示与.save()保存时,在进行位于后面的一个操作时,可能会出现错误 IndexError: list index out of range。
import numpy as np
import matplotlib.pyplot as plt
import matplotlib.animation as animation

def data_gen():
    for cnt in range(500):
        t = cnt / 10
        yield t, np.sin(2*np.pi*t) * np.exp(-t/10.)

def init():
    del xdata[:]
    del ydata[:]
    for i in range(2):
        ax[i].set_ylim(-1.1, 1.1)
        ax[i].set_xlim(0, 10)
        # line.append(ax[i].plot([],[],lw=2))
    return line

def run(data):
    # update the data
    t, y = data
    xdata.append(t)
    ydata.append(y)
    for i in range(2):
        xmin, xmax = ax[i].get_xlim()
        if t >= xmax:
            ax[i].set_xlim(xmin, 2*xmax)
            ax[i].figure.canvas.draw()
        line[i].set_data(xdata, ydata)
    return line

fig, ax = plt.subplots(2,1)
line=[] # 存储plot()返回的lines对象,需要作为全局变量,
for i in range(2):
    line.extend(ax[i].plot([], [], lw=2))
    ax[i].grid()
xdata, ydata = [], []
# 由于传入的frames参数是一个generator,save()不能探知到要存储的帧数,所以只默认保存100帧,通过save_count参数来指定正确的保存帧数。
ani = animation.FuncAnimation(fig, run, data_gen, blit=False, interval=10,repeat=False, init_func=init,save_count=500)
ani.save("dubwave.gif", writer='pillow')
plt.show()
效果如下:

ArtistAnimation
ArtistAnimation(fig, artists, *args, **kwargs)
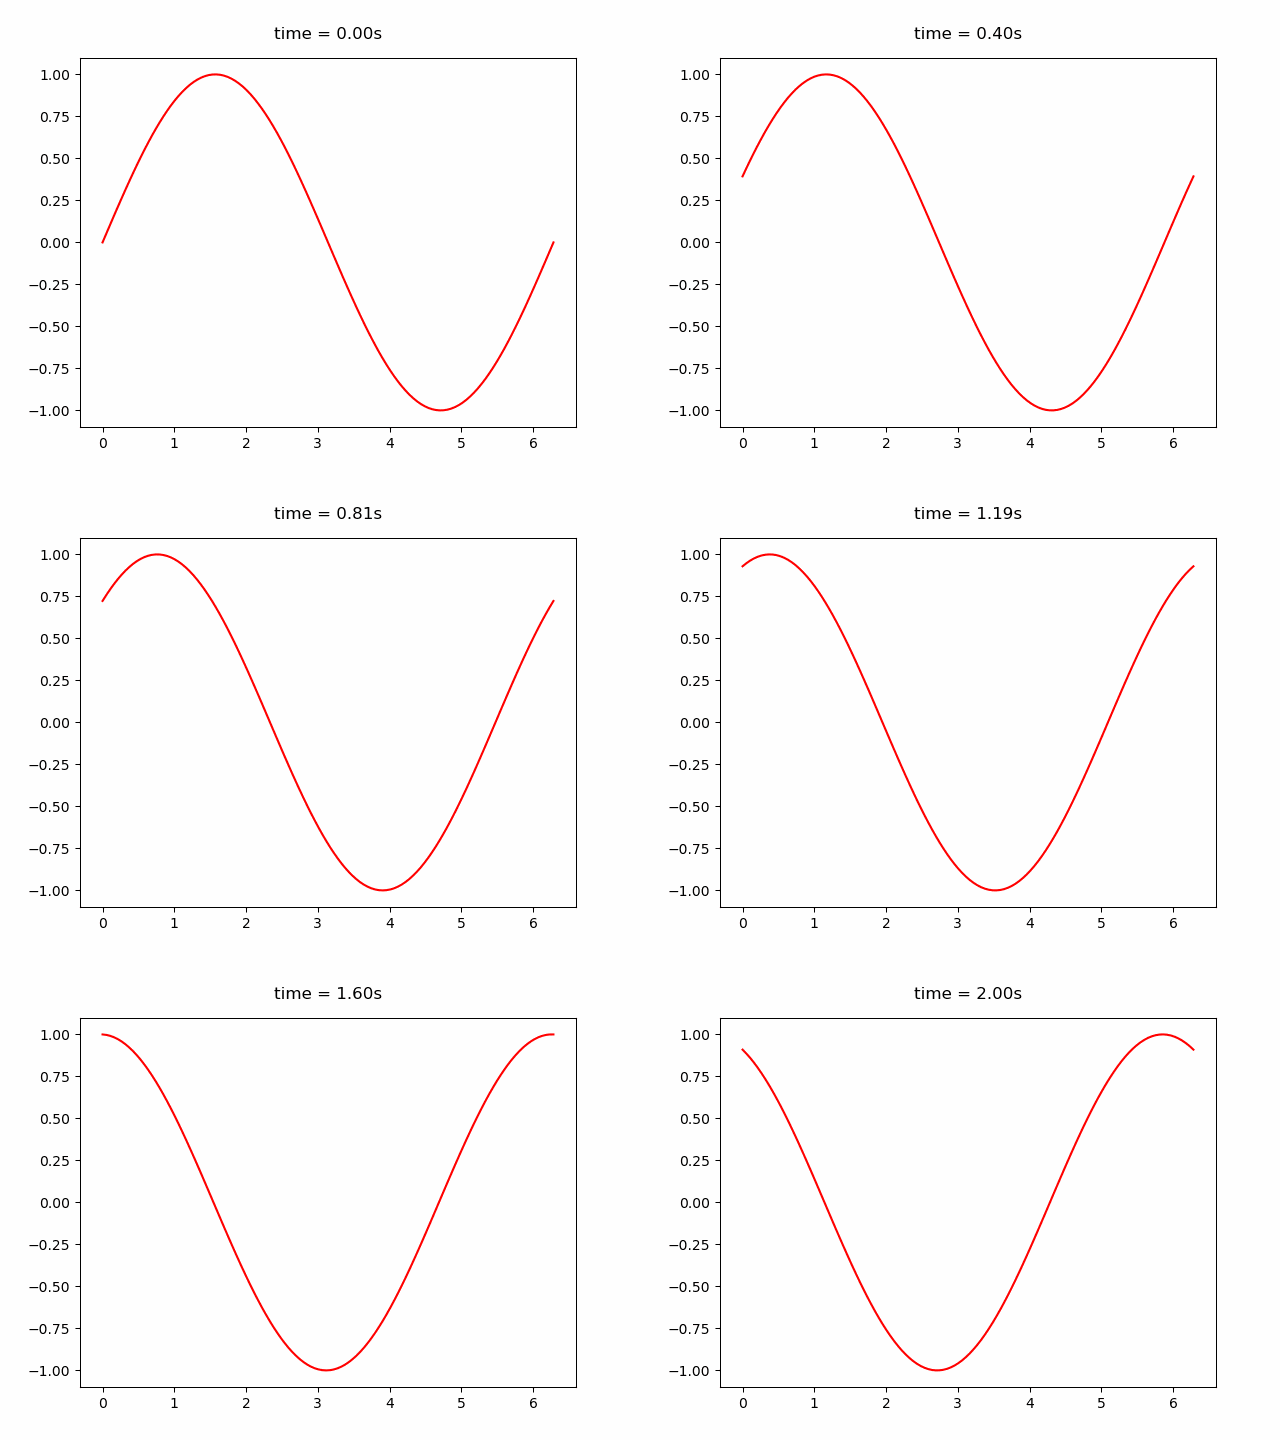
该方法通过遍历artists列表中的artist对象来实现动画每一帧的变化,因此在实例化该动画类前需要先将要变化artist存储到列表中,更多参数说明,下面一个简单的代码实现正弦函数随时间变化的动画:
import numpy as np
import matplotlib.pyplot as plt
import matplotlib.animation as animation

fig = plt.figure()
ax=fig.add_subplot()
def f(x, y):
    return np.sin(x+y)
x = np.linspace(0, 2 * np.pi, 120)
ims = []
for i in np.linspace(0,2,100):
    im,=ax.plot(x,f(x,i),'r')
    title= ax.text(0.5,1.05,"time = {:.2f}s".format(i),
                    size=plt.rcParams["axes.titlesize"],
                    ha="center", transform=ax.transAxes, )
    ims.append([im,title])
ani = animation.ArtistAnimation(fig, ims, interval=50, blit=False)
ani.save("sin.gif",writer='pillow')
plt.show()
效果如下:

这里还有一个用matplotlib.animation.ArtistAnimation绘制运动小球的示例:

保存动画
无论是FuncAnimation还是ArtistAnimation生成的对象(本质都是Animation)都可以直接使用save()方法保存动画,支持gif、MP4等多种文件格式。
save(self, filename[, writer, fps, dpi, ...])
writer参数指定文件写入方法,默认是writer='ffmpeg',此外还有’pillow’、’imagemagick’以及自定义MovieWriter对象等。不过要注意各写入器都需要对应的库才可以正常工作,我系统上是有ffmpeg的但是使用默认writer参数仍然会出错。
另外也可以导出为HTML5视频,参考
# to_html5_video(self[, embed_limit])
## 示例
html=ani.to_html5_video()
with open('sin.html','w') as f:
     f.write(html)
参考